Digital Design and Data Visualization
Digital design and data visualization, right? Many are already eager to know more and deep about each and possibly their relationship. In short words, digital design simply means the transformation of anything on the screen or digital device at large.
It is a process of creating or turning stuff into a digital view (either through an app or webpage) by designation.


Digital design compromises different things and that’s why it is sometimes classified as graphic design when it is not. This is because any “graphical design” is a digital design and not all digital design can be classified as “graphical design”.
For instance, if a real building structure is turned into a graphical design using any kind of software; it is automatically a digital design. Why? Because it is now transformed to be viewed on-screen and the screen is a digital device. Like the design and the creation of a delivery app; which is a digital design and is not a graphic design.
Digital design represents an essential purpose and it is somehow broad than one could expect. It is like a visual content communication interface that can serve kinds of stuff like information, service, or product that can interact with digital devices. They serve more than just in graphical form and they are mostly for a useful purpose.
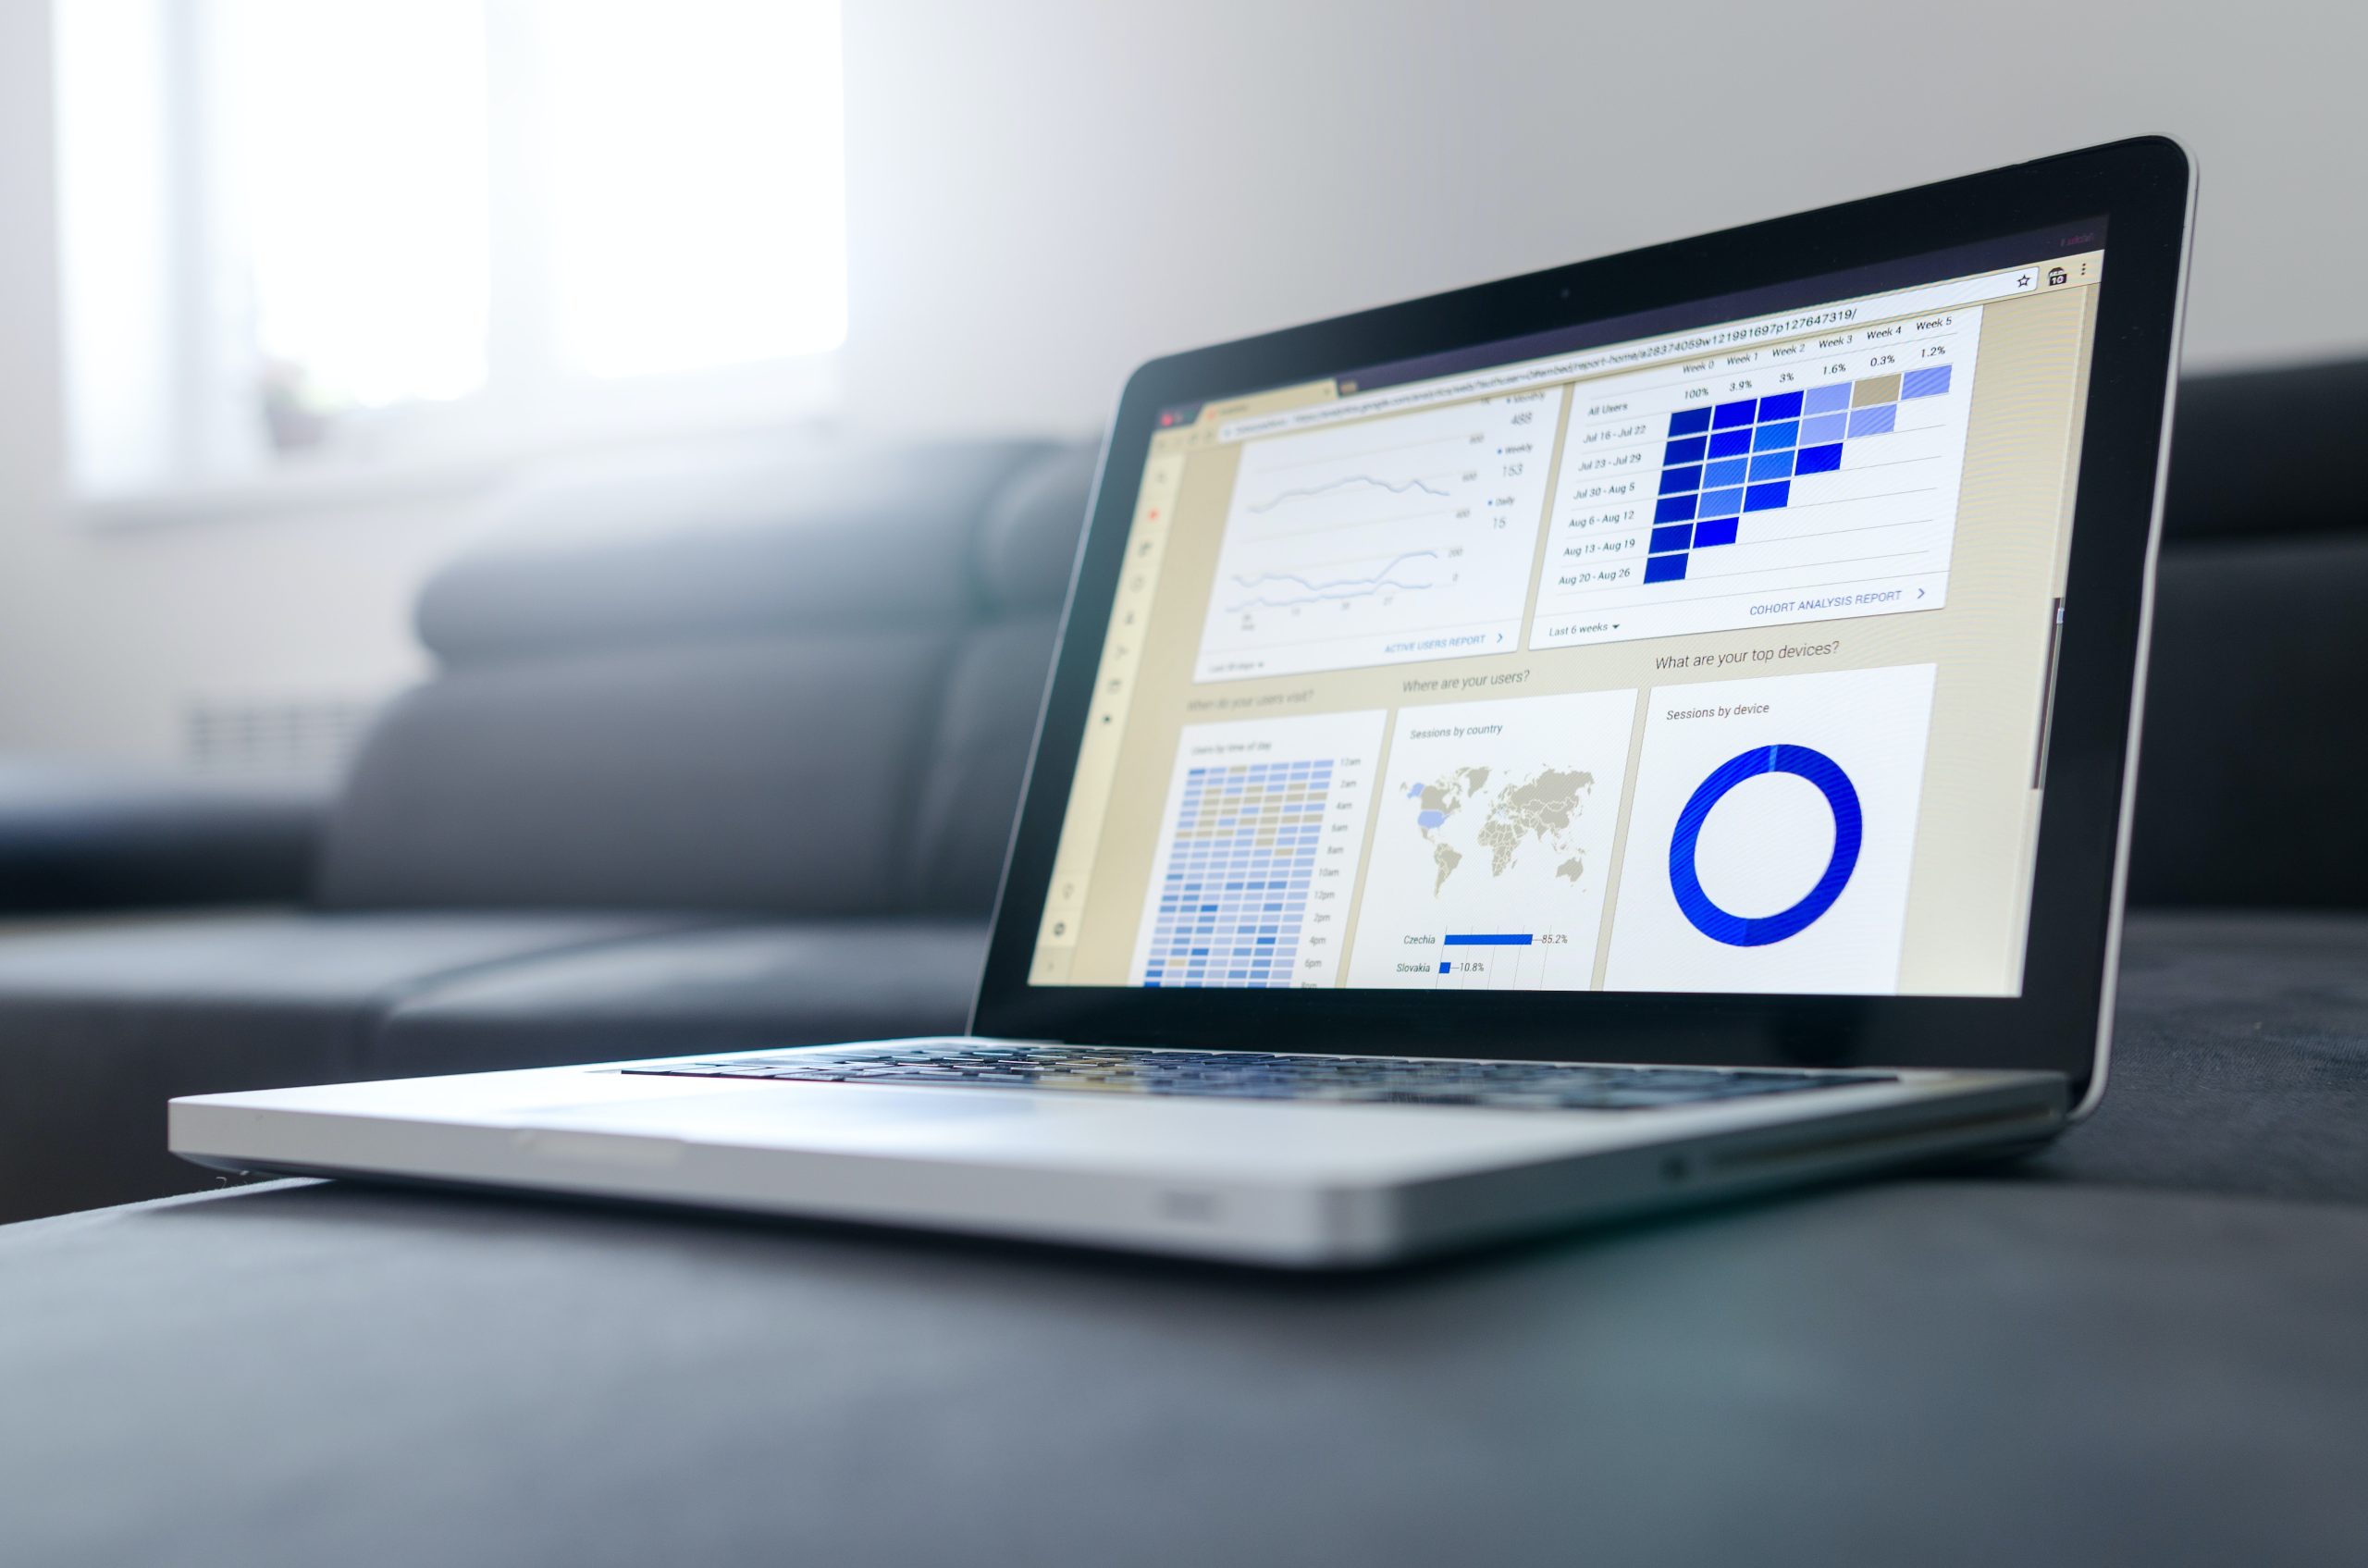
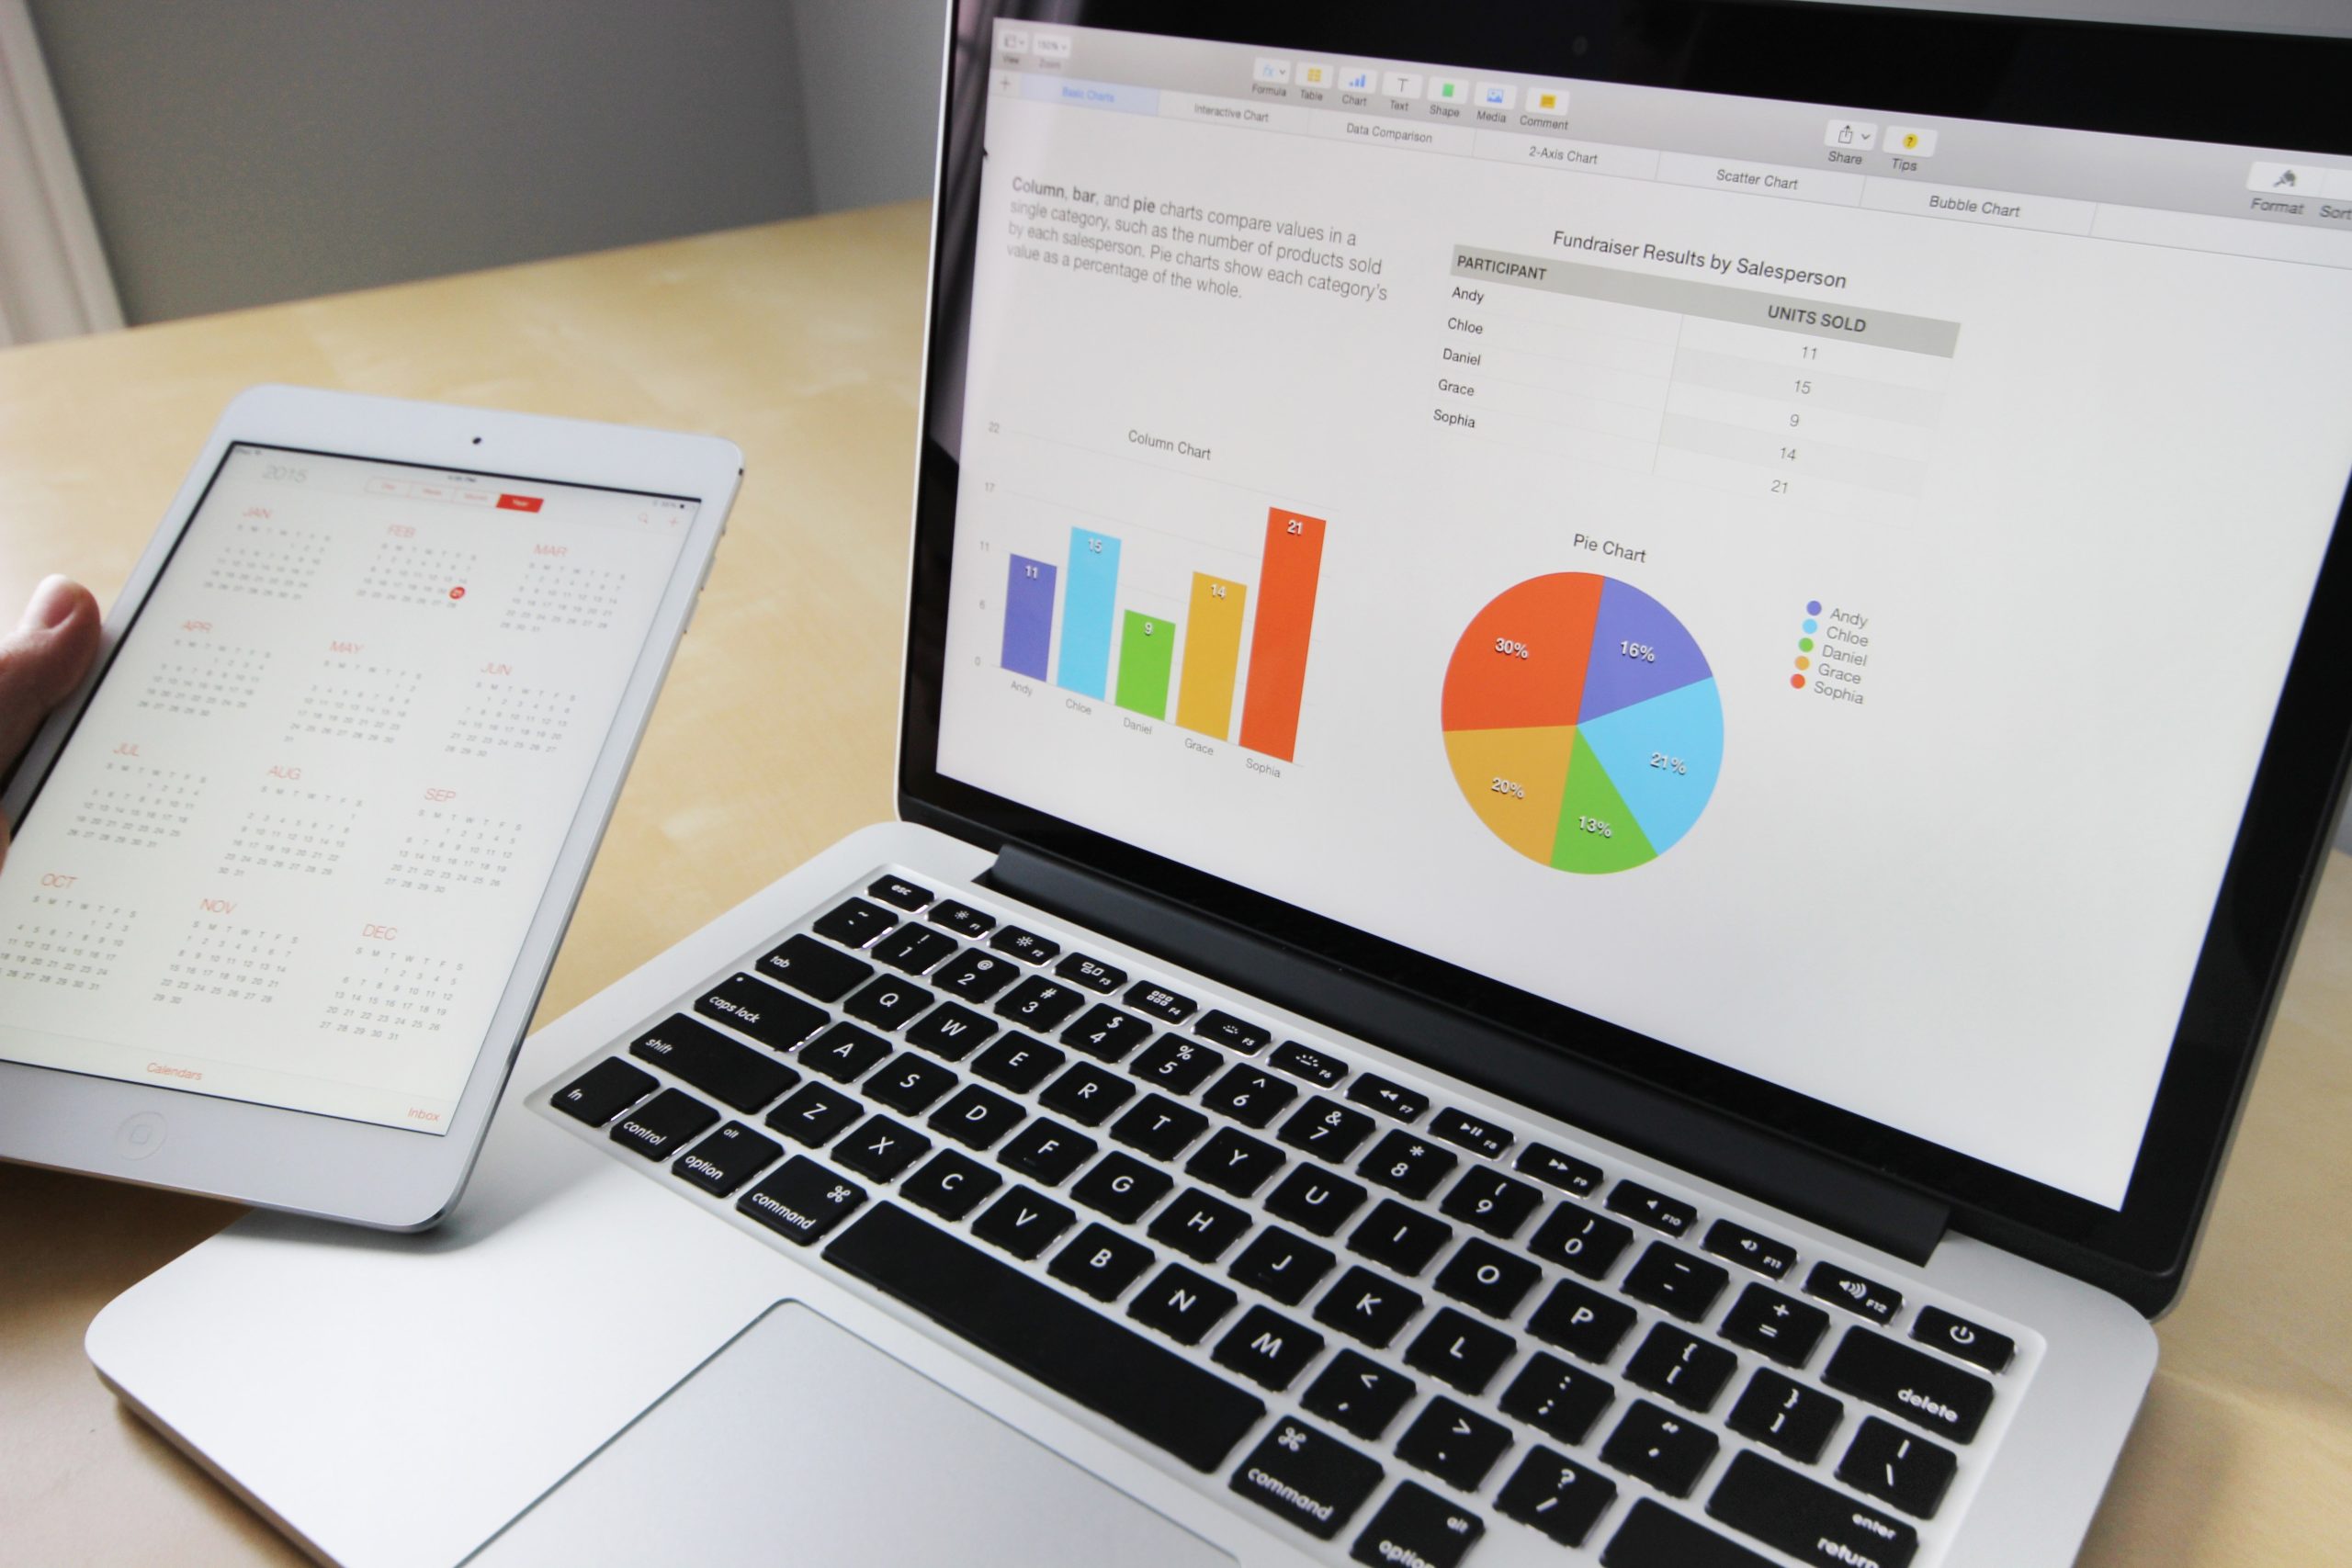
Data visualization means the process of converting information to a graphic format. It is just like Graphic Design, with some little differences. It serves as an easy way for communicating information (that is in any format) in a graphical format.
Data visualization can be used in conveying information in different formats to graphic formats of many specifications. The specifications include;
– Accuracy
Through data visualization, information (of any kind of format) can be transformed accurately into a graphical format without having issues. For example, the designing of students’ databases in the classroom. Possibly the students are much in number or there are different other categories, it can be simply represented in graphical form without resulting in inappropriate database results.
– User-friendly Use
Hard or inconvenient-to-use information can be converted to a graphical format that can be used or navigated by users easily without having issues or making them bored due to bad experiences. For example, viewing or interacting with a very large information in excel format on a mobile device might be hard for most people, then it is converted to graphical form even by splitting the information through groups or numbers but it can be seen, used, and accessed easily without issue.
– Scalable
This is a process where data visualization is used to represent any kind of information, no matter the format or size; it can be converted to a graphical format.
Digital design and data visualization work hand in hand. They go together in putting the imagination to reality on the screen. They help in conveying data quickly and understanding information mode for people.
How To Learn Digital Design And Data Visualization
Digital design and data visualization has kept making life easy for people across the world to interact and understand information at a fast time. Due to the nature of some information (format), people find it hard most times in interacting and understanding them.
But through data visualization, information can be transformed in such a way that people can easily understand without being bored or tired as it might be if not transformed. That’s the process that keeps becoming more adaptive across the world. There is basic knowledge of learning digital design and data visualization.
The strong process in data visualization is classified to be Data > Graph > Understanding. This simply means from the origin of any kind of data should be converted to a graphical form for understanding aspects.